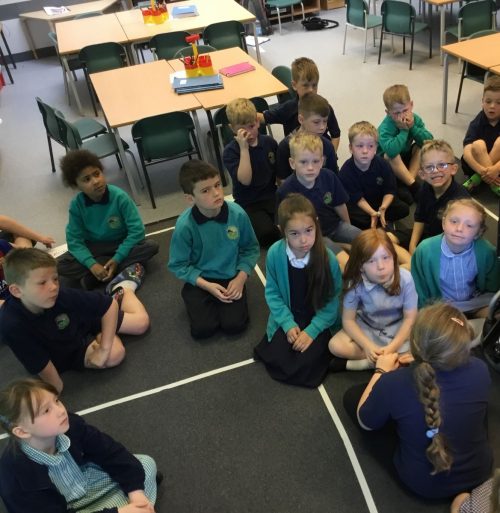

This is week in maths we have been learning how to use Carroll Diagrams to collect and organise data. We helped Mr Fallon find out which subjects in school were the most popular. We also put ourselves into a class Carroll Diagram!
Which subject would you have chosen?
Maths or Literacy?
Art or PE?
Science or Geography?
We found out that maths was most popular!
